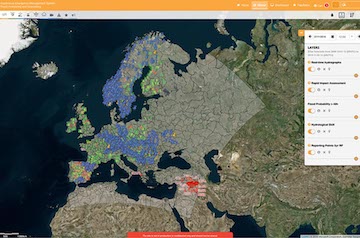
European wide, observation-based flood monitoring
CEMS Hydrological Data Collection Centre collects near real-time water level and river discharge observations including, where available, the national/regional thresholds from a large number of data providers. The information is displayed in the “National flood monitoring” layer in the EFAS map viewer, with gauging stations exceeding their national/regional thresholds being highlighted. Gauging station density is generally not the same as at the national/regional level; moreover, depending on the data provider, a different number of threshold levels might exist. To meet the requirements of the Member States, the “National flood monitoring” layer is visible only to EFAS partners.
Gridded meteorological maps
Initial conditions for EFAS forecasts are computed using gridded, near real-time meteorological observations. A large-number of in-situ meteorological data is collected from various data providers and interpolated to a regular grid. The interpolated grids for daily accumulated precipitation and daily average temperature are available in the map viewer and are important for verifying the quality of the initial conditions for the hydrological model. This page explains the methodology for the generation of the interpolated grids. Furthermore, a 24-hour accumulated observed precipitation information based on SYNOP stations is also available.
Soil moisture and snow water equivalent
To support the interpretation of the flood forecasts EFAS also displays two key hydrological variables, soil moisture and snow water equivalent, that might trigger or increase the risk of flooding. These maps are simulated using near real-time interpolated meteorological observations to run OS LISFLOOD and are also used as initial conditions for the flood forecasts. For both hydrological variables, soil moisture and snow water equivalent, their respective anomalies are calculated to compare the simulations with the climatology. Where available, the user can also compare these maps with values derived from satellite observations. The satellite-derived soil moisture and snow water equivalent products available from the EFAS Map Viewer are described by the following page: Initial Conditions Products Overview.
CEMS Global Flood Monitoring (CEMS GFM)
The near real-time CEMS Global Flood Monitoring (GFM) product is integrated into the EFAS map viewer, providing continuous monitoring of floods by immediately processing and analyzing all incoming satellite data from Copernicus Sentinel-1 Synthetic Aperture Radar (SAR), a Copernicus constellation of two polar-orbiting satellites. The advantage of this products is that no time is lost to human interventions in the fully automatic process of imagery processing. Additionally, it achieves robustness, redundancy, and accuracy through the implementation of three different flood detection algorithms when generating flood and water extent maps. The 10 GFM information products, derived from S-1 data, can be roughly grouped into 4 categories: water bodies, quality-related, S-1 data and impacts estimates. Provided by GFM are the latest available imagery for each Sentinel-1 overpass and depending on the type, the datasets are made available in different formats. The user can furthermore request a full time series of all products that are achieved in GFM’s database. Detailed information about GFM is available from the GFM Product Definition Document, GFM Product User Manual, and the EODC public Wiki.

