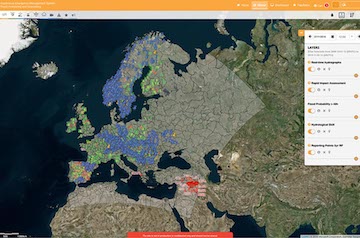
Historical model performance and forecast evaluation is important to understand the strengths and weaknesses of the system and to build confidence in its results. The model performance and the skill of the operational medium-range forecasts is summarised using a set of metrics which highlight different aspects of model simulations and forecasts.
EFAS performance is regularly evaluated for specific events and summarized in the Validation and skill scores page.
EFAS-IS presents three different products in the Evaluation tab:
- Medium-range forecast skill
- Model performance – Catchments
- Model performance – Points
Medium-range forecast skill
The skill assessment of the ECMWF-ENS re-forecasts produced with the Lisflood hydrological model makes use of the continuous ranked probability skill score (CRPSS).
The forecasts are evaluated against proxy observations. The forecast persistence, which is the 6-hour river discharge from the previous time step, is used as a benchmark. CRPSS values greater than 0 indicate positive skill, with a value of 1 indicating a perfect forecast. CRPSS values less than 0 indicate that the benchmark performs better than the EFAS medium-range forecast system.
The forecast skill outlook does not present the CRPSS directly but instead presents the maximum lead time (in days) when EFAS medium-range river discharge forecast skill (CRPSS) is greater than 0.5.
Detailed results are shown when clicking on individual stations. These show the forecast skill (in terms of CRPSS) as a function of lead time. In addition, results show the continuous ranked probability score (CRPS), which varies from 0 (perfect score) to Infinity (Inf), for both the EFAS medium-range forecasts and the persistence benchmark forecast approach. Read more in the wiki under EFAS medium-range forecast skill.
Model performance
The historical model performance is evaluated using the model simulations and river discharge observations. The modified Kling-Gupta Efficiency (KGE) is used for the calibration stations. The KGE ranges from –Inf to 1, with a perfect value of 1.
Two different visualization approaches are used, yet providing the same information in terms of model performance. One presents the performance at the catchment scale (Model performance - Catchments) and another the performance at the location where river discharge observations are available, as dots located at the catchment outlets (Model performance - Points).
Detailed results are shown when clicking on corresponding stations in the 'Model Performance - Points' layer. These results include the decomposed terms of the KGE metric, namely correlation, bias ratio and variability ratio, with all being optimized to 1. Results also show the monthly discharge climatology and the daily discharge time series over the calibration period. Read more in the Wiki under EFAS hydrological model performance and EFAS hydrological model performance products.

