by Calum Baugh, EFAS Computational Centre
After the release of the extended domain on 16 May 2018, which included a new version of the LISFLOOD hydrological model, it was noted that there were far fewer ERIC reporting points being displayed, which raised the concern that more flash flood events may be missed. Therefore, a new verification exercise was performed with ERIC forecasts using the extended domain. The verification was performed for each 00 and 12 UTC forecast from 2018-05-16 until 2018-07-10 for each lead time in 24 hour intervals up to 120 hours [5 days] ahead. The forecasts were compared against heavy precipitation observations from the European Severe Weather Database [ESWD: www.eswd.eu].

Results of the verification are shown in the figures above. Figure 1 illustrates the hits, false alarms and hit rate for the ERIC indicator for different exceedances probabilities above the 5-year return period and different lead times (1, 2, and 3 days).
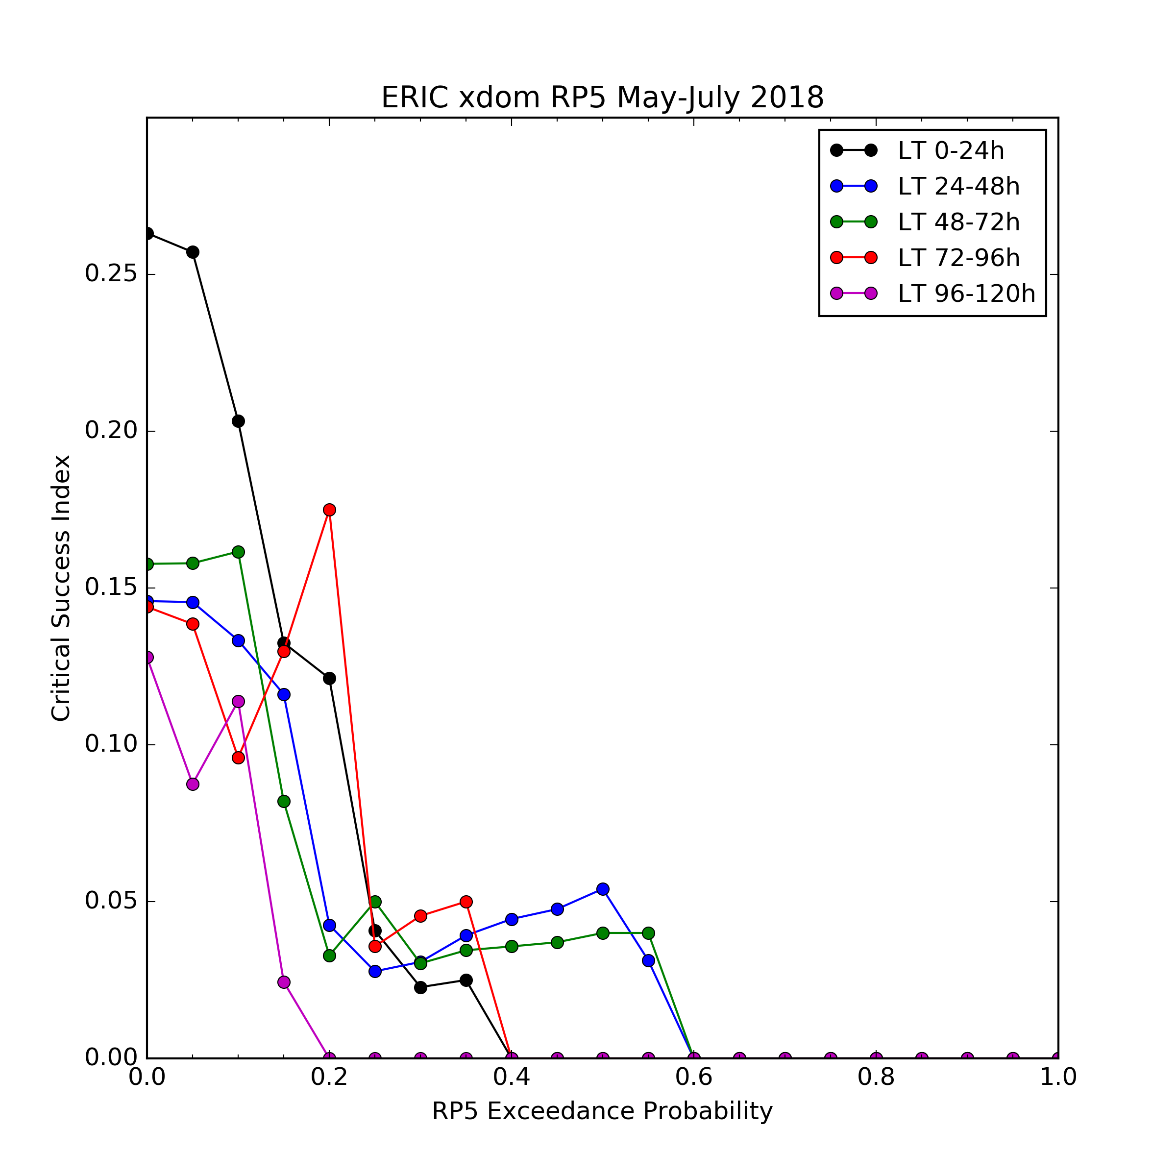
Figure 2 illustrates critical success index for the ERIC indicator for different exceedances probabilities above the 5-year return period and different lead times (1, 2, 3, 4 and 5 days).

The results suggest that the plotting thresholds of the ERIC indicator as well as the thresholds for sending out an EFAS Flash Flood notifications should be changed to have the best balance between hits, false alarms and misses. Therefore, the following rules will be applied for plotting of the ERIC indicator reporting points and the ERIC affected area:
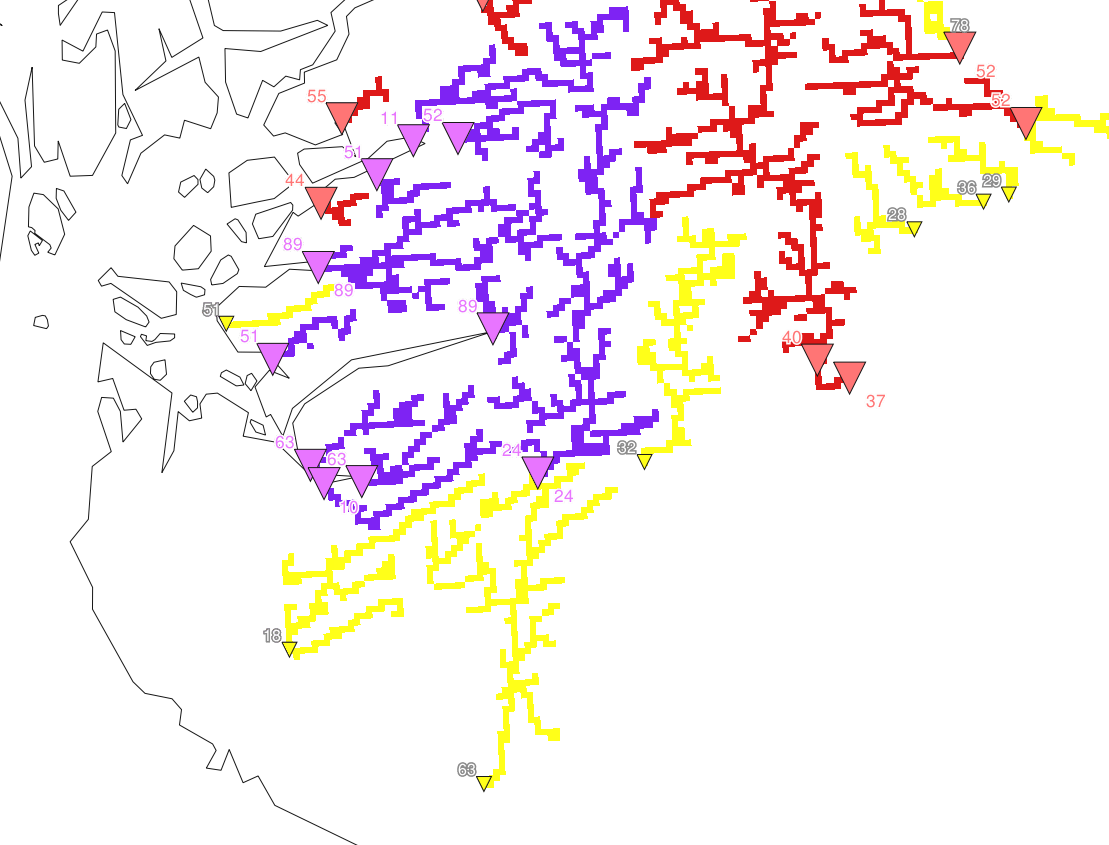
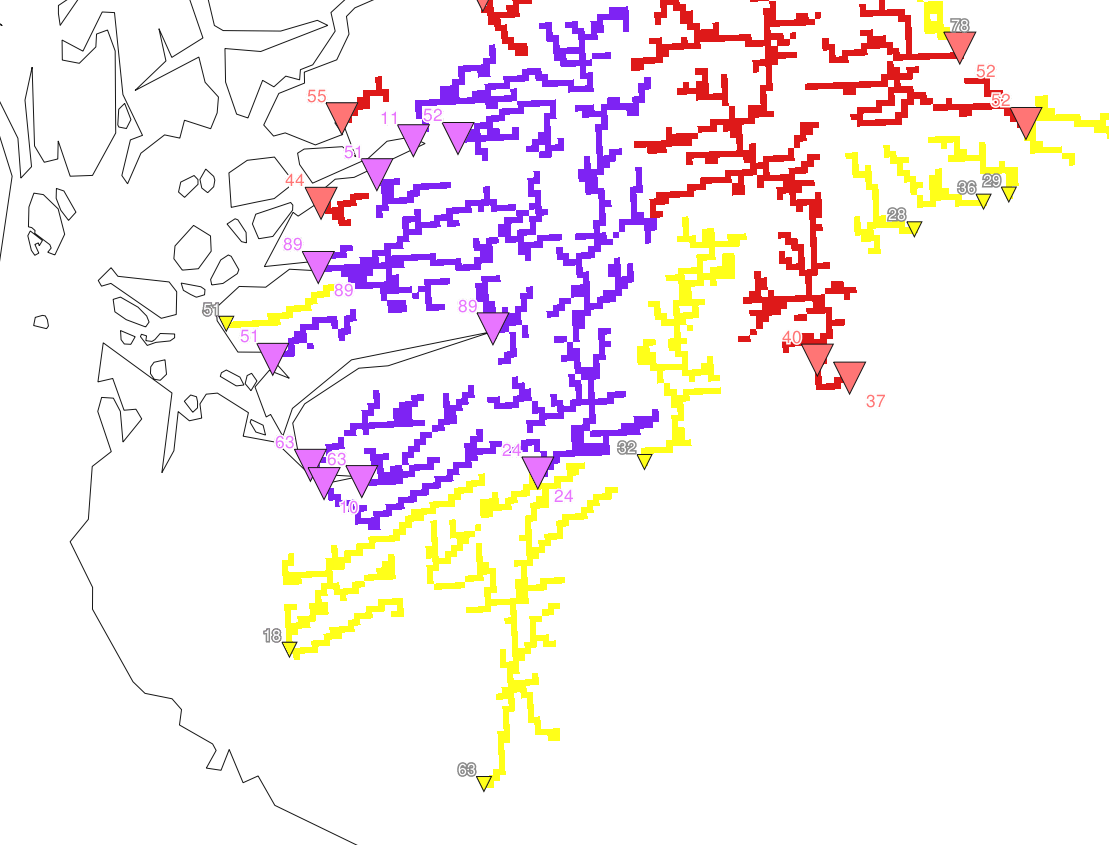
- Yellow ERIC triangle: Probability (RP 2yr) >= 15% and probability (RP 5yr) < 5%
- Red ERIC (small) triangle: Probability (RP 5yr) >= 5 and probability (RP 5yr) < 10%
- Red ERIC (large) triangle: Probability (RP 5yr) >= 10% and probability (RP 20yr) < 10%
- Purple ERIC (large) triangle: Probability (RP 20yr) >= 10%
An example of the appearance of the updated ERIC flash flood layers in EFAS is shown in Figure 3 below.

The new criteria for issuing an EFAS flash flood notifications is as follows:
Issue flash flood notifications when the exceedance probability of the 5-year return period is >= 10% and the lead time is less than 72 hours
The impact of these new criteria will be monitored closely, with the verification procedure being re-performed once more observation data become available. Further details on the verification of the ERIC indicator will be published in the upcoming EFAS bulletins.

