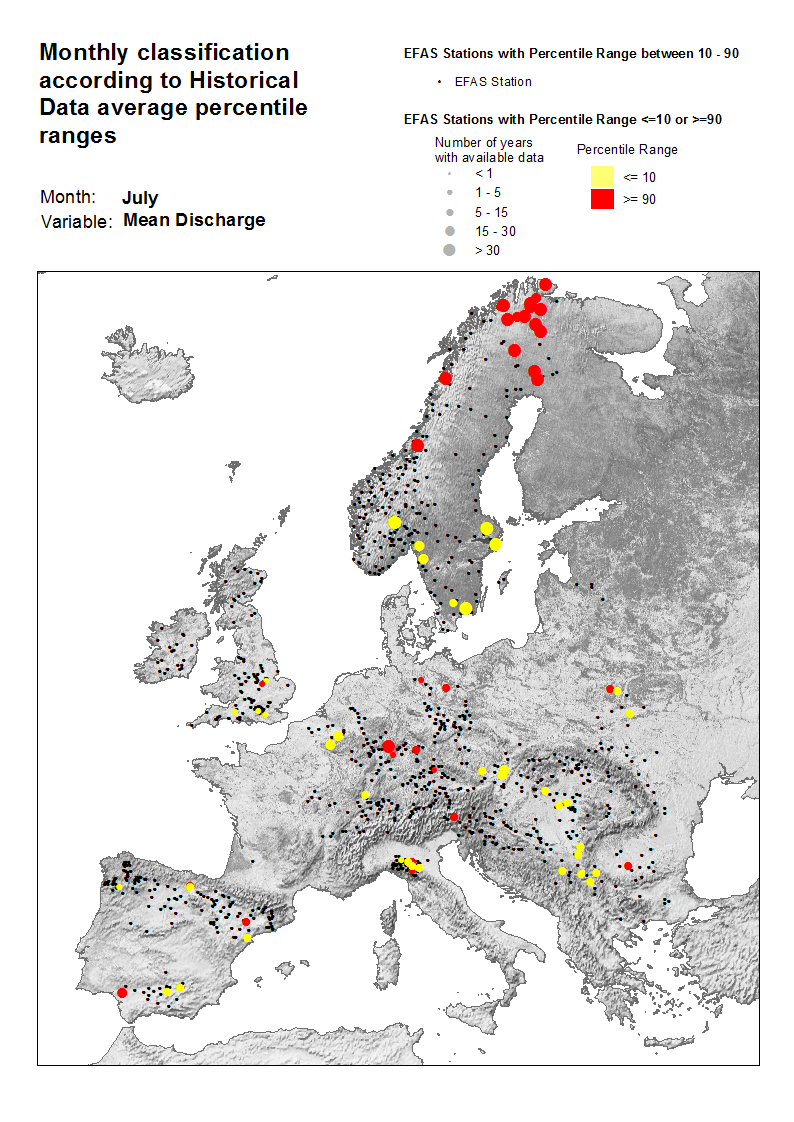
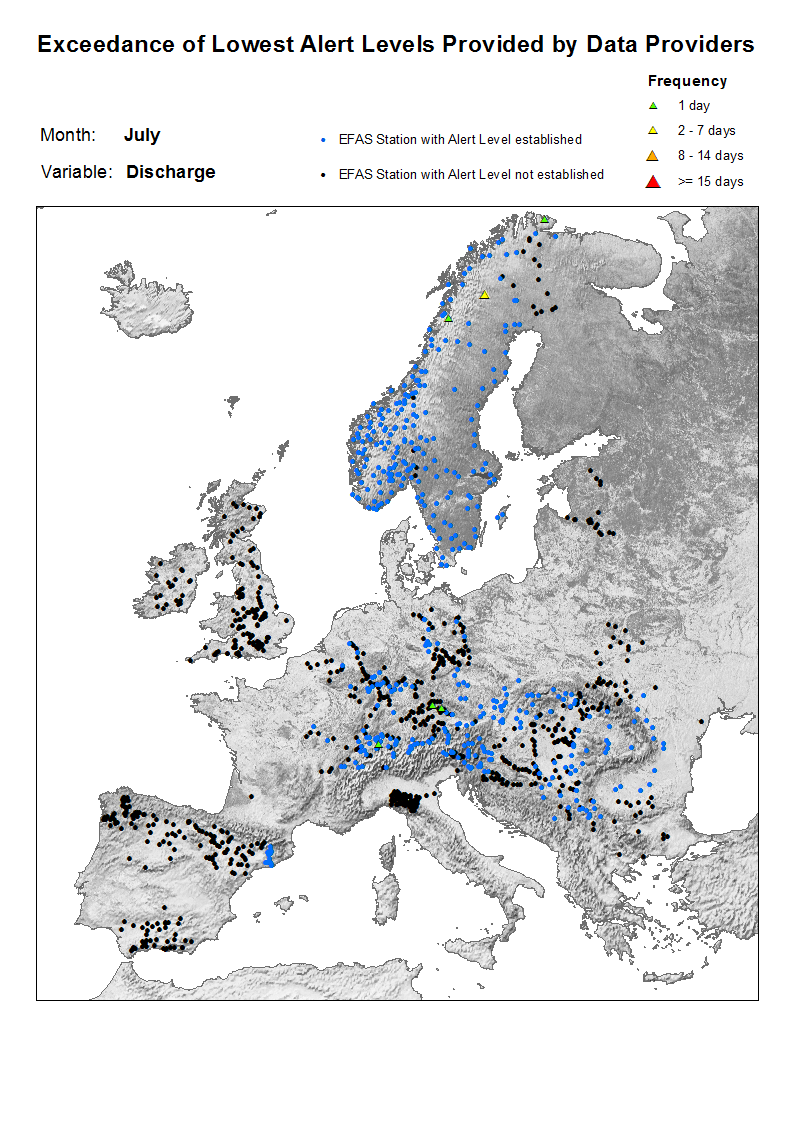
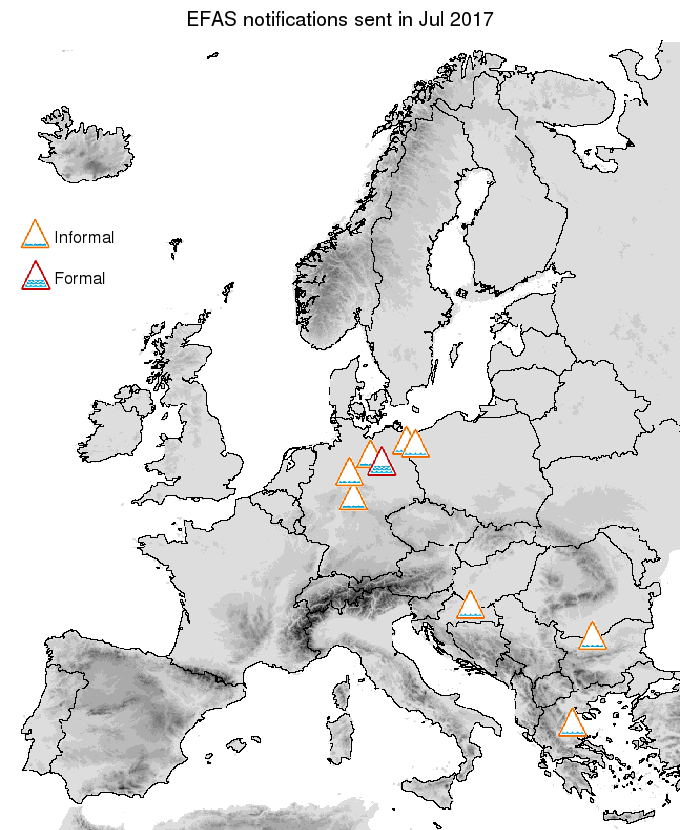
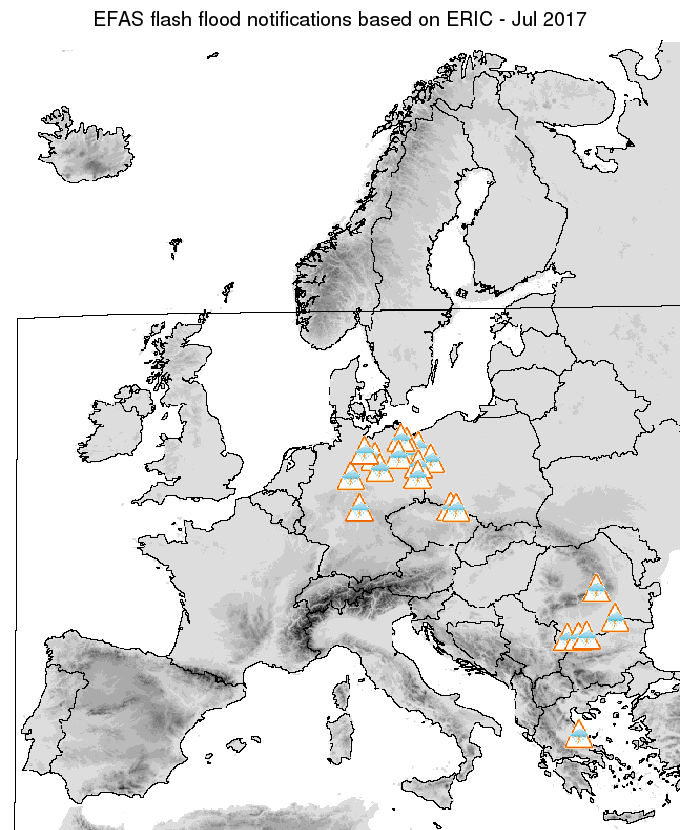
Mon, 31/07/2017 - 12:00 EFAS flood notifications sent for July 2017 Flash flood notifications sent for July 2017 Accumulated precipitation [mm] for July 2017 Precipitation anomaly [%] for July 2017, relative to a long-term average (1990-2013). Blue (red) denotes wetter (drier) conditions than normal Mean temperature [°C] for July 2017 Temperature anomaly [°C] for July 2017, relative to a long-term average (1990-2013). Blue (red) denotes colder (warmer) temperatures than normal Monthly discharge anomalies July 2017 Alert level exceedance for July 2017 07 2017 Give your Feedback
![Accumulated precipitation [mm] for July 2017](/sites/default/files/2017-12/A1_pr_201707_0.png)
![Precipitation anomaly [%] for July 2017, relative to a long-term average (1990-2013). Blue (red) denotes wetter (drier) conditions than normal](/sites/default/files/2017-12/A2_pr_anomaly_201707_0.png)
![Mean temperature [°C] for July 2017](/sites/default/files/2017-12/A3_tm_201707_0.png)
![Temperature anomaly [°C] for July 2017, relative to a long-term average (1990-2013). Blue (red) denotes colder (warmer) temperatures than normal](/sites/default/files/2017-12/A4_tm_anomaly_201707_0.png)