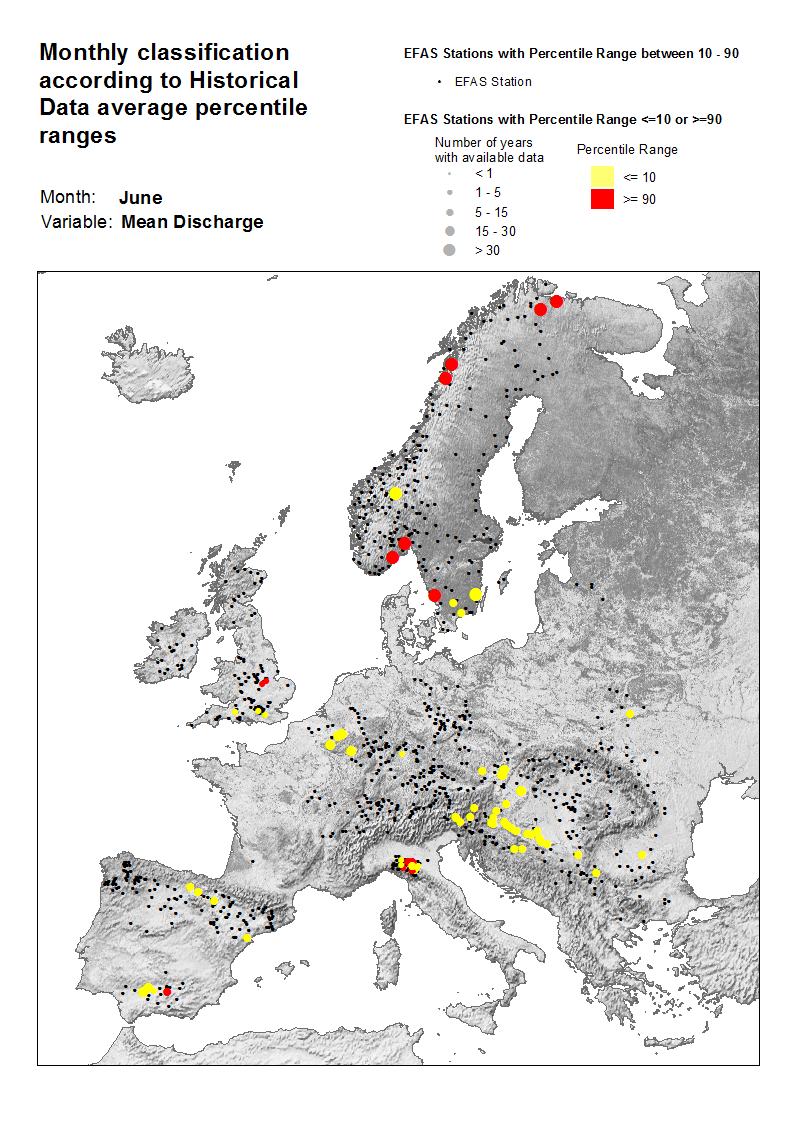
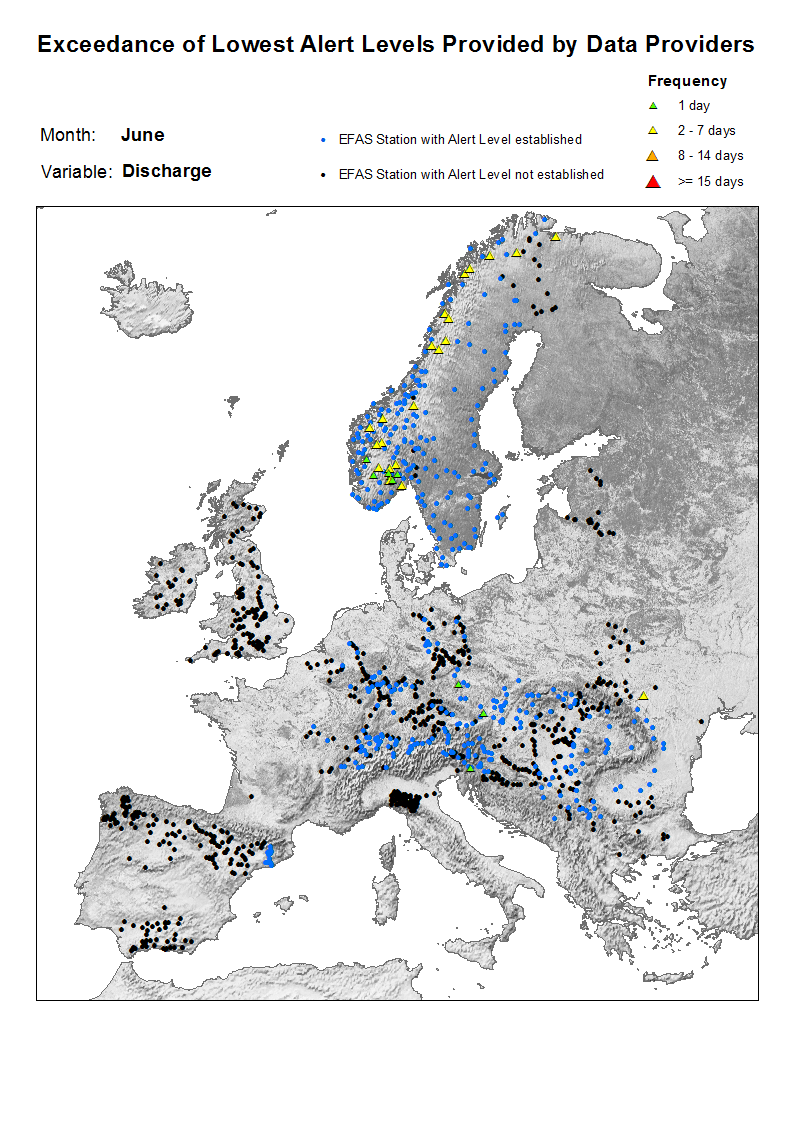
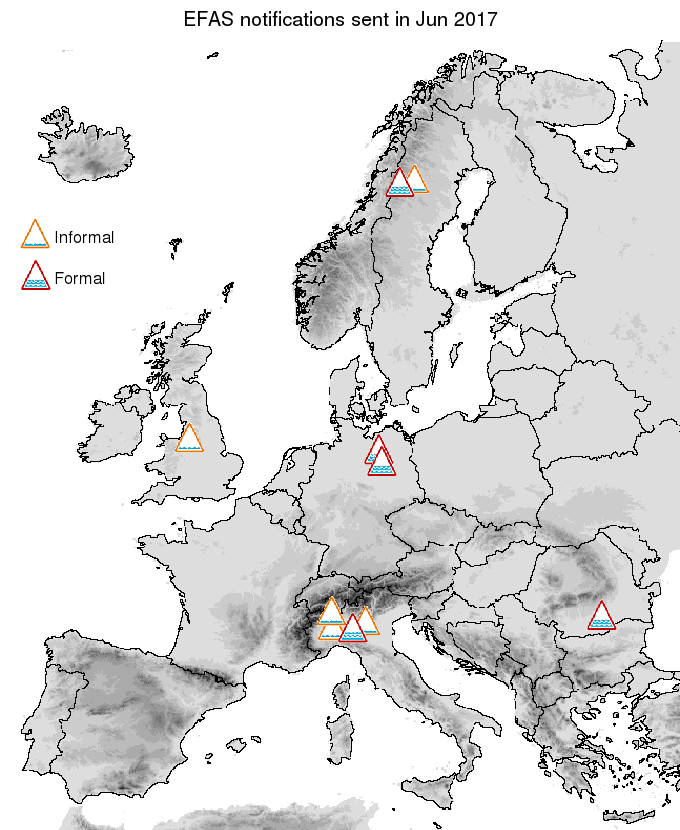
Sat, 10/06/2017 - 12:00 EFAS flood notifications sent for June 2017. Flash flood notifications sent for June 2017. Accumulated precipitation [mm] for June 2017 Precipitation anomaly [%] for June 2017, relative to a long-term average (1990-2013). Blue (red) denotes wetter (drier) conditions than normal Mean temperature [°C] for June 2017. Temperature anomaly [°C] for June 2017, relative to a long-term average (1990-2013). Blue (red) denotes colder (warmer) temperatures than normal Monthly discharge anomalies June 2017 Monthly discharge anomalies June 2017. Figure 2. Alert level exceedance for June 2017 06 2017 Give your Feedback
![Accumulated precipitation [mm] for June 2017](/sites/default/files/2017-12/A1_pr_201706_0.png)
![Precipitation anomaly [%] for June 2017, relative to a long-term average (1990-2013). Blue (red) denotes wetter (drier) conditions than normal](/sites/default/files/2017-12/A2_pr_anomaly_201706_0.png)
![Mean temperature [°C] for June 2017.](/sites/default/files/2017-12/A3_tm_201706_0.png)
![Temperature anomaly [°C] for June 2017, relative to a long-term average (1990-2013). Blue (red) denotes colder (warmer) temperatures than normal](/sites/default/files/2017-12/A4_tm_anomaly_201706_0.png)